
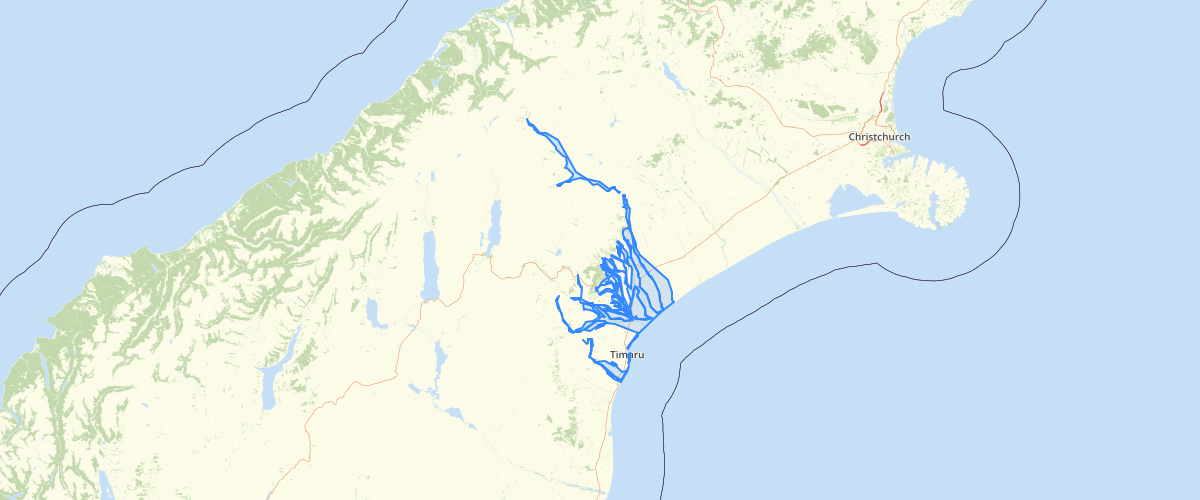
Canterbury - Timaru liquefaction susceptibility 2013
Request AccessCanterbury - Timaru liquefaction susceptibility 2013 - This dataset delineates zones of liquefaction susceptibility. The zones are based on simplified geological groupings. Most of the dataset, outside of Timaru township, is based on the 1:300,000 Timaru district liquefaction potential map(Figure 1) in McCahon, 2013, Liquefaction Hazard in Timaru District (Environment Canterbury report R13/29) but uses the more accurate boundaries of geological units directly from the GNS Science1:250,000 QMAP geological map shapefile as the zone boundaries. In Timaru township, including the three areas of moderate liquefaction potential and three zones of low potential, the zones are digitised directly from the 1:25,000 Timaru township liquefaction potential map (Figure 2) in the above report, and also from Borelog Location sheets 3 (1:4,000), 4 (1:5,000) and 6 (1:10,000) from Appendix E of the above report. These zones differ from the zones in the 1:300,000 map (Figure 1), and from the 1:250,000 QMAP geological map unit boundaries, but are assumed to be more accurate. http://files.ecan.govt.nz/public/liquefaction-hazard-timaru-district.pdf
Metadata
| Date | 27/03/2017 |
| License | CC BY 3.0 |
Sample Properties
- {} 8 keys▶
- 1
- "River, stream or beach sediment <10,000 years old"
- "Liquefaction damage is possible"
- "Desktop assessment with shallow testing (MBIE Level B assessment), deep testing (MBIE Level C) if required"
- "Desktop assessment with shallow testing (MBIE Level B assessment), deep testing (MBIE Level C) if required"
- "Desktop assessment with shallow testing (MBIE Level B assessment), deep testing (MBIE Level C) if required"
- 6119.174896218448
- 402253.7677285718