
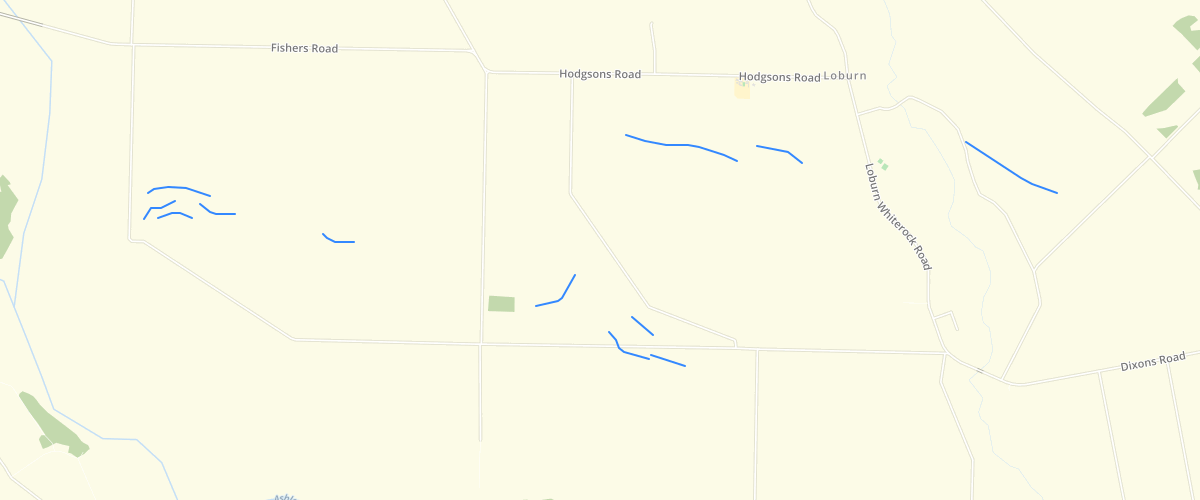
Canterbury - Ashley Fault Zone Active Fold Axes 2014
Request AccessCanterbury - Ashley Fault Zone Active Fold Axes 2014 - There are seven main data fields. The first four are based directly on those from the GNS Science 1:250,000 scale geological map (QMAP) 'Folds' data structure. The last three are based directly on the Waimakariri District generalised active faults dataset (Barrell & Begg 2013; GNS Science Consultancy Report 2012/326; Environment Canterbury Report No. R13/28. This folds dataset supersedesthat of Barrell & Begg (2013) in the area covered by this dataset.'ACCURACY' provides a qualitative indication with which the fold axis is mapped, via one of two attributes; ''approximate' (the fold axis is located somewhere within the general vicinty of the mapped line), 'inferred' (the presence of the fold axis is hypothesised based on various geological or landform considerations, but there is no direct evidence known for its actual presence at that location).'TYPE' specifies the nature of the mapped fold ('monocline', 'anticline' or 'syncline').'FACING' is a characteristic that applies only to monoclines, and denotes the directional quadrant towards which the monocline is down-warped, based on compass points N, S, E, W, or a combination of two adjacent directions.'SHAPE_LEN' is the length of the mapped line in metres.'WDC_name' is the assigned name of the fault to which the fold is related, and corresponds to the names used in the Barrell & Begg (2013) dataset.'Certainty' indicates whether the fold represented by the line is 'definite', 'likely' or 'possible', as defined in the Barrell & Begg (2013) report.'Surf_form' provides an assessment of whether or not the fold represented by the line is 'well expressed', 'moderately expressed' or 'no expressed', as defined in the Barrell & Begg (2013) report.This dataset was compiled for presentation at a scale of 1:35,000 in the report, but the data were captured at more detailed scales.Lines representing folds were mapped at ~1:5,000 scale. The mapped fold axis lines are less precise than the fault lines because the fold scarps or arches are less clearly defined in the landscape than the fault scarps. Lines representing monoclines are considered to be accurate to +/- 20 m at best, while syncline or anticline axis positions are considered to be accurate to +/- 40 m at best. Accompnaying report is Barrell, D. J. A.; Van Dissen, R. J. 2014. Assessment of active fault ground deformation hazards associated with the Ashley Fault Zone, Loburn, North Canterbury, GNS Science Consultancy Report 2013/173 / Environment Canterbury Report No. R14/77.
Metadata
| Date | 10/09/2018 |
| License | CC BY 3.0 |
Sample Properties
- {} 15 keys▶
- "approximate"
- "anticline"
- ""
- "Ashley Fault"
- "definite"
- "moderately expressed"
- 1
- "MANCAP"
- 2
- "GNS Science"
- "2014-01-01T00:00:00.000Z"
- "GNS Science"
- "2014-01-01T00:00:00.000Z"
- 251.85615765
- 251.85615764577926